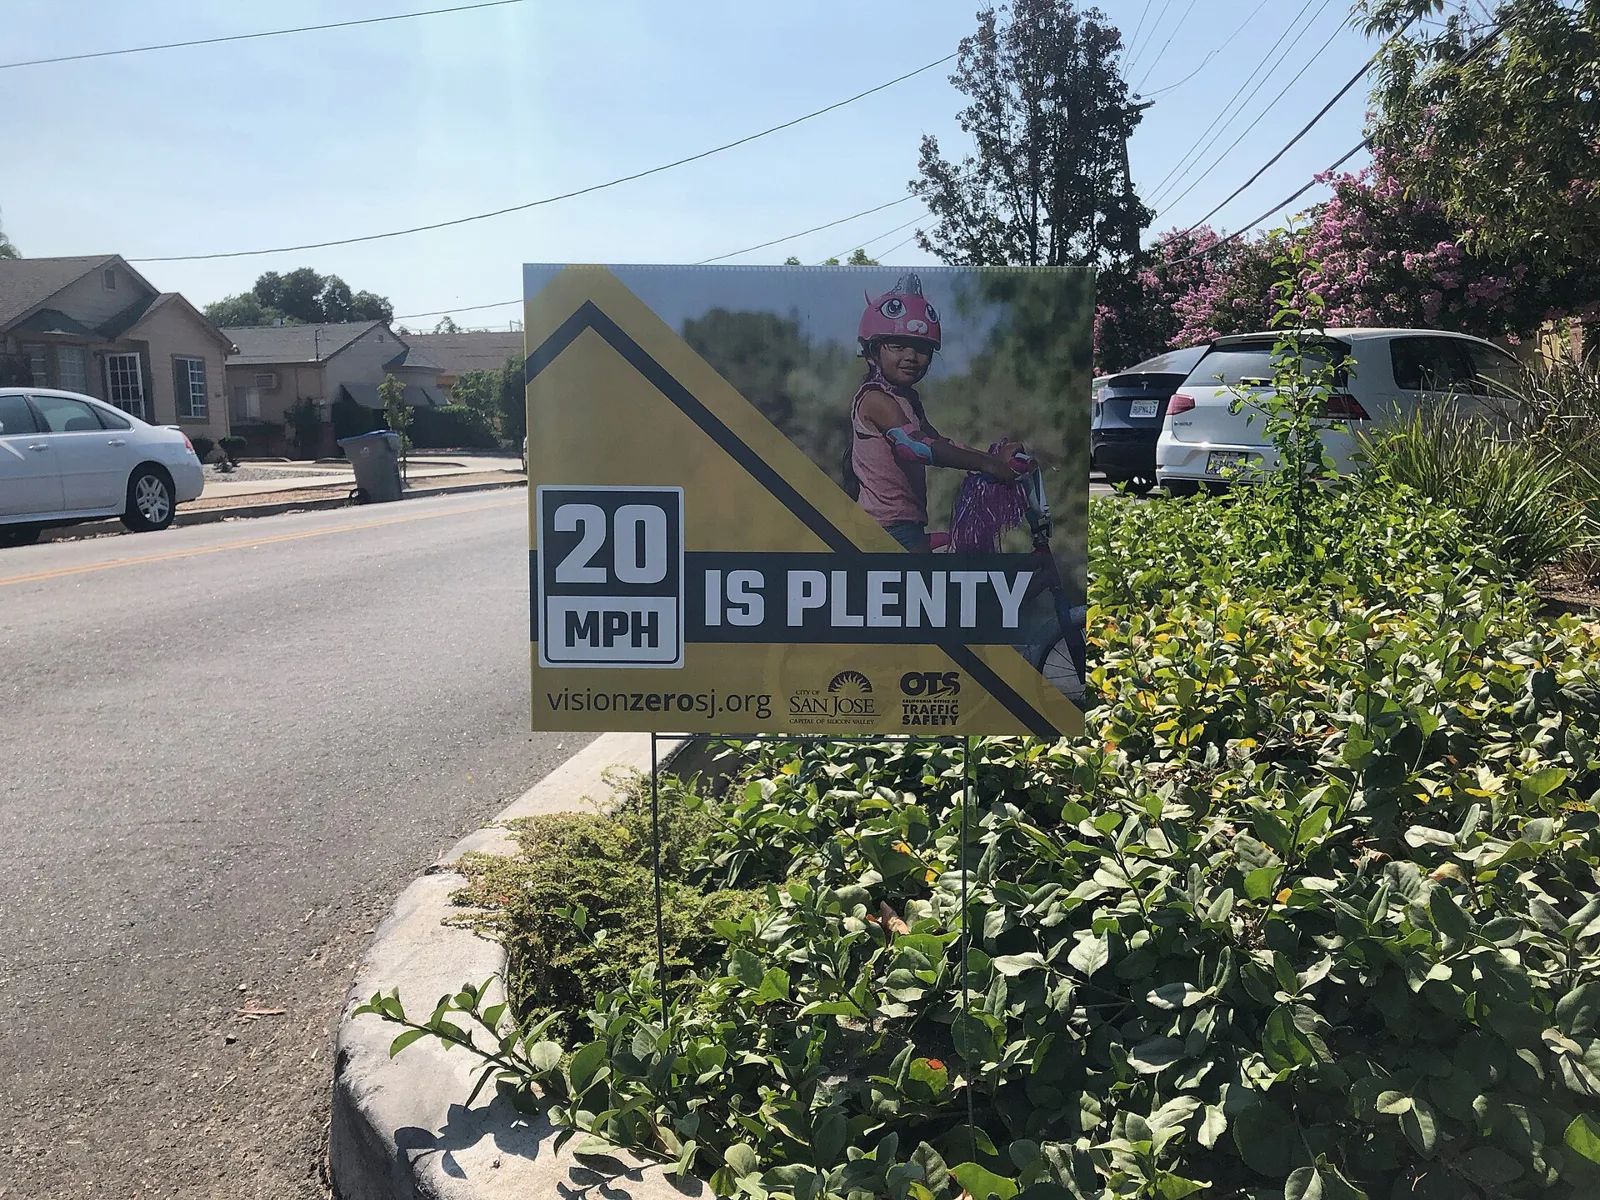
A Swedish parliament vote in 1997, lane cuts in San Francisco and a United Nations decade: the case for roads that forgive mistakes, and the evidence so far.
Vision Zero is a road safety project, approved by Sweden's parliament in 1997, that aims for no deaths or serious injuries by designing roads around what the human body can survive. Road diets cut lane numbers or widths to calm traffic, and the UN Decade of Action set five pillars for 2011-2020.
On German country roads limited to 100 km/h, the death rate in 2010 was 7.7 per billion kilometres travelled. On city streets limited to 50 km/h it was 5.2. On the autobahn it was 2.0, even though that road carried 31% of the country's motorised traffic. The number on the sign says less about danger than the road around it does, and that gap is the thinking behind Vision Zero.
Born in Sweden, Vision Zero sets its target at zero deaths and zero serious injuries on the road, and it puts part of the responsibility on the people who design roads rather than only on drivers. Road diets, the Safe System approach and the United Nations' Decade of Action for Road Safety all pull the same way, and each has a record that is easier to judge than the slogans suggest.
What is Vision Zero?
Vision Zero is a multi-national road safety project that aims for a road system with no deaths and no serious injuries. It started in Sweden, where parliament approved it in October 1997, although it is also described as having been introduced in 1995. Its core idea is that life and health cannot be traded against other benefits.
That is a deliberate break from the usual method, in which planners put a money value on life and health and use it to decide how much to spend on reducing risk. Vision Zero rests instead on an ethical position: it can never be acceptable for people to be killed or seriously injured while moving through the road transport system.
It also changes who carries the blame. On most road systems the road user bears the full responsibility for safety, whereas Vision Zero spreads it between users and the designers of the system. Since then it has been taken up by countries and smaller jurisdictions in varying forms, and how it is described differs widely from place to place.
German rural roads limited to 100 km/h killed more people per kilometre than city streets limited to 50 km/h.
How does the Safe System approach decide how fast is safe?
The Safe System approach starts from a simple test: in a crash, the energy of the impact should stay below the level likely to kill or seriously injure. Where that level sits depends on how well protected the people involved are, so speed limits are matched to what bodies and cars can survive.
For an unprotected pedestrian struck by a vehicle, the chance of survival drops quickly above 30 km/h (19 mph). For a properly restrained occupant, the critical speeds are 50 km/h (31 mph) for side impacts and 70 km/h (43 mph) head-on. Speeds above 100 km/h (62 mph) can be tolerated only where the road itself rules out head-on and side collisions.
The consequences for road design are direct. If a city wants vehicles to go faster than 30 km/h where pedestrians cross, the crossings must be separated from the traffic; if not, the crossing or the vehicle has to hold speeds to 30 km/h. The safest roads have no possibility of a side or frontal impact at all. They go by the names Type 1 (motorways, freeways, Autobahns), Type 2 (the "2+2" road) and Type 3 (the "2+1" road), and they combine crash barriers between opposing traffic with limited access, grade separation and bans on slower and more vulnerable users.
The numbers behind the thresholds come from research. A study by Joksch in 1993 found that the chance of a driver dying in a multi-vehicle collision rises as the fourth power of impact speed, so a small increase in speed has an outsized effect. The Swedish Road Administration drew its injury risk curves from crash-reconstruction data, using the change in speed as a stand-in for acceleration, which is hard to measure directly. The same logic explains why a median barrier removes head-on crashes with death or serious injury, and why roundabouts, particularly those with speed-reducing approaches, see very few of them.
Fatality rates on German roads
| Road type | 2010 deaths per billion travel-kilometres | 2013 deaths per billion travel-kilometres |
|---|---|---|
| Autobahn | 2.0 | 1.9 |
| Urban streets | 5.2 | 4.7 |
| Rural roads | 7.7 | 6.6 |
In both years the autobahn carried 31% of motorised traffic. It accounted for 11% of Germany's traffic deaths in 2010 and 13% in 2013. Across roads generally, urban streets see most of the injuries, rural roads see most of the deaths and motorways are safest for the distance driven. Undivided rural roads can be very dangerous even when the limit looks modest.
What is a road diet?
A road diet cuts the number or width of travel lanes on a road, usually to reduce crashes. A four-lane road might become one lane each way, freeing space for cycle lanes, wider footpaths or a turning lane. The technique also goes by lane reduction, road rechannelization and road conversion.
A "lane diet" narrows lanes without removing them, to slow vehicles and make room for other uses. Car lanes are typically cut to a maximum of 2.8 metres (9.1 ft), with left-turn storage lanes held at 2.7 to 3.0 metres (9 to 10 ft). The space saved can go to footpaths, planted boulevards, cycle lanes, reserved tram tracks, a flush median or a centre turn lane, a reversible lane or a breakdown lane. Detroit's Lodge Freeway, where a lane became a breakdown lane after I-96 was built, is one example.
Traffic volume decides whether a diet works. Done properly, traffic does not move to other streets, because the old road had more capacity than it needed. Below about 19,000 vehicles a day, road diets usually work, and they can succeed up to about 23,000 if the design goes further, with roundabouts in place of signals or calming on parallel streets. Beyond 20,000 vehicles a day the safety gain comes with more congestion and the chance of traffic diverting elsewhere.
Do road diets actually reduce crashes?
Researchers and the US Federal Highway Administration found that properly implemented road diets can be expected to cut overall crash frequency by 19 to 47%, with larger reductions in small urban areas than in big cities. The top figure is disputed, because many of the Iowa roads in the study were converted after bypasses had taken traffic away.
Results in practice vary. In Seoul, a road diet in the centre of Sinchon-dong in 2014 was followed within six months by a 34% fall in accidents against the previous year, while visitor satisfaction rose to 70% from 14% in 2013 and the number of shoppers climbed 28.9%. In Waverly, Iowa, Bremer Avenue went from four lanes to three in 2018 and traffic fell by 41%, yet crashes on the avenue rose 5%, from 60 in 2014-2017 to 63 in 2021-2024. Most of its traffic moved to two arterials, where crashes went from 16 to 75, a 368% increase, even as crashes city-wide fell 16%.
Los Angeles recorded a 32% rise in traffic fatalities since it began its Vision Zero road diet plan in 2015, a scheme that has proved controversial. In Rutland, Vermont, Woodstock Avenue was reduced from four lanes to three, with cycle lanes, and then returned to four lanes in June 2014, mainly because of opposition from businesses along the road.
Emergency response is the sharpest worry. A study funded by the Iowa Department of Transportation and the CDC looked at one road-dieted arterial in Cedar Rapids and found no meaningful gain or loss in response times, and 41% of responders across the state said road diets hurt response times. The Los Angeles Times, reporting on the 2018 Camp Fire, asked whether the conversion of a four-lane road in Paradise, California to one lane each way had worsened gridlock during the evacuation. Mayor Jody Jones did not think it mattered, and said no town could evacuate everyone at once.
Where have road diets been tried?
San Francisco has completed the most of any American city, over 40 since the late 1970s. Its Valencia Street, cut from four lanes to two with a centre turn lane and cycle lanes in March 1999, became a national model for the common 4-to-3 conversion.
London used the same tool during the COVID-19 pandemic to give more space to cycling. On Park Lane, the northbound side that once had three lanes was cut to a single motor lane, a bus lane and a separate cycle track.
What has Sweden's Vision Zero achieved?
In 1997 the Swedish Parliament introduced a policy requiring fatalities and serious injuries to fall to zero by 2020. All new roads are built to the standard and older ones are modified, and the policy also includes measures aimed at drivers and vehicles. Sweden's road death toll was already declining before 1997 and kept doing so under the policy, but deaths have shown no improvement since 2013.
Who else has adopted Vision Zero?
Netherlands and New Zealand
The Dutch sustainable safety approach differs by accepting that humans are to blame in most crashes. Roads are therefore made self-explaining, so it is obvious where road users should be and how to behave, and dangerous mixes of mass, speed and direction are kept apart. Roundabouts hold crossing speeds to 30 km/h, and above that speed in built-up areas mopeds, cyclists and pedestrians are given separate paths. The Dutch later added the idea of forgiving roads, which soften a crash when one happens, a principle at the core of both Dutch and Swedish policy.
New Zealand released its Road to Zero 2020-2030 strategy in July 2019, modelled on Vision Zero, and adopted it in 2020. In March 2024 a new government confirmed it would reverse the previous government's speed limit reductions, raising limits by 20 km/h, introducing variable limits for school zones and judging future changes against both safety and economic criteria.
United Kingdom
British road safety plans resemble Vision Zero but do not formally adopt it. Blackpool set the earliest target of any British city, in 2007, followed by Edinburgh in May 2010, Brighton and Hove in 2014 and Bristol in March 2015. Transport for London says it is working towards zero deaths and serious injuries, and after a consultation in mid-2019 a 20 mph limit now covers every central London road it manages. The Campaign for Safe Road Design, a partnership of 13 road safety stakeholders, argues that safer infrastructure could cut deaths on British roads by 33%.
North America and India
Chicago set a goal of ending transport deaths within ten years in May 2012. New York City adopted a plan in January 2014. In its first four years crashes and injuries rose though deaths fell, and later analysis found an immediate drop of about 6% in pedestrian crashes and declines in casualties over nearly a decade. San Francisco's plan was introduced the same month, after 25 pedestrian and cyclist deaths in 2013 alone, and passed with all 11 supervisors in support. Los Angeles followed in September 2014.
Edmonton announced in September 2015 that it had become the first city in Canada to adopt Vision Zero officially, although its 2016-2020 strategy sets no target of zero deaths. Toronto announced in June 2016 a plan to cut deaths and serious injuries by 20 per cent within a decade, then passed Vision Zero 2.0 in 2019 with lower speed limits and automated enforcement. In India, Haryana became the first state to adopt the approach when its programme launched on 3 May 2017 in 10 districts, since extended to all of them.
What did the UN Decade of Action for Road Safety set out?
The United Nations General Assembly proclaimed the Decade of Action for Road Safety 2011-2020 in March 2010, aiming first to level off, and then to lower, the projected number of road deaths worldwide. It estimated that 5 million lives could be saved over the decade.
The need was stark. The Global status report on road safety puts the toll from crashes at nearly 1.3 million lives a year, with 20-50 million more people injured. Low-income and middle-income countries suffer over 90% of the deaths and injuries while holding only 48% of the world's registered vehicles. Without action, crashes were predicted to cause around 1.9 million deaths a year by 2020.
The decade grew from a call by the Commission for Global Road Safety in 2008 and a ministerial conference hosted by Russia in November 2009. Its resolution asked every member state to set road safety targets and to involve universities, business, the media, and victims and their families. It was launched on 11 May 2011 in more than 100 countries, and landmarks from the Sydney Harbour Bridge to Trafalgar Square and Times Square were lit with its symbol. Austria, China, France and New Zealand revised or adopted road safety laws around the launch.
What were the five pillars of the Global Plan?
The UN Road Safety Collaboration drew up a Global Plan as a framework. Its five pillars concern the management of road safety, roads and mobility, vehicles, road users and the response after a crash.
The first calls for a lead agency, a national strategy, long-term targets with funding, and data systems to monitor results. The second asks for roads to be planned, built and regularly assessed with pedestrians, cyclists and motorcyclists in mind. The third covers vehicle standards, new car assessment programmes, minimum features such as seat belts, and proven technology such as anti-lock brakes and electronic stability control. The fourth concerns behaviour: model laws, steady enforcement, higher use of seat belts and helmets, less drink driving and speeding, and graduated licensing for novice drivers.
A Road Safety Fund raised money for national plans from companies, the public and other donors, and a private-sector coalition, Together for Safer Roads, drew up a white paper that put the cost of collisions to the global economy at 518 billion US dollars a year, up to 3 percent of a nation's GDP.
What does a forgiving road look like?
Much of it is hidden in detail. Modern guardrails are anchored to the ground so they cannot spear a passenger compartment, light poles are made to break at the base and some signs and hydrants collapse on impact. Mini-traffic circles at neighbourhood junctions have been shown to cut collisions sharply, and shared space schemes remove signals, signs and even the line between road and footpath.
Turning across oncoming traffic is the most common cause of deaths in built-up areas, and fixes include turn lanes, protected signal phases, the Michigan left and roundabouts. Where none exists, drivers waiting to turn are advised to keep their wheels straight, so that a shunt from behind does not push them into oncoming traffic, and to glance away once the road looks clear. After a time, an oncoming vehicle can look further away and slower than it is, and looking away breaks the illusion.
What deadlines have Vision Zero cities set?
Targets set under Vision Zero run on different clocks. Sweden's policy named 2020 as the year for zero deaths and serious injuries, San Francisco's plan set 2024 as the date to eliminate traffic deaths, and Los Angeles chose 2025. Chicago looked to ten years from May 2012, and Toronto to a 20 per cent cut within a decade of 2016. New Zealand's Road to Zero strategy covers 2020 to 2030, and in March 2024 its government confirmed that it would reverse the earlier speed limit reductions.