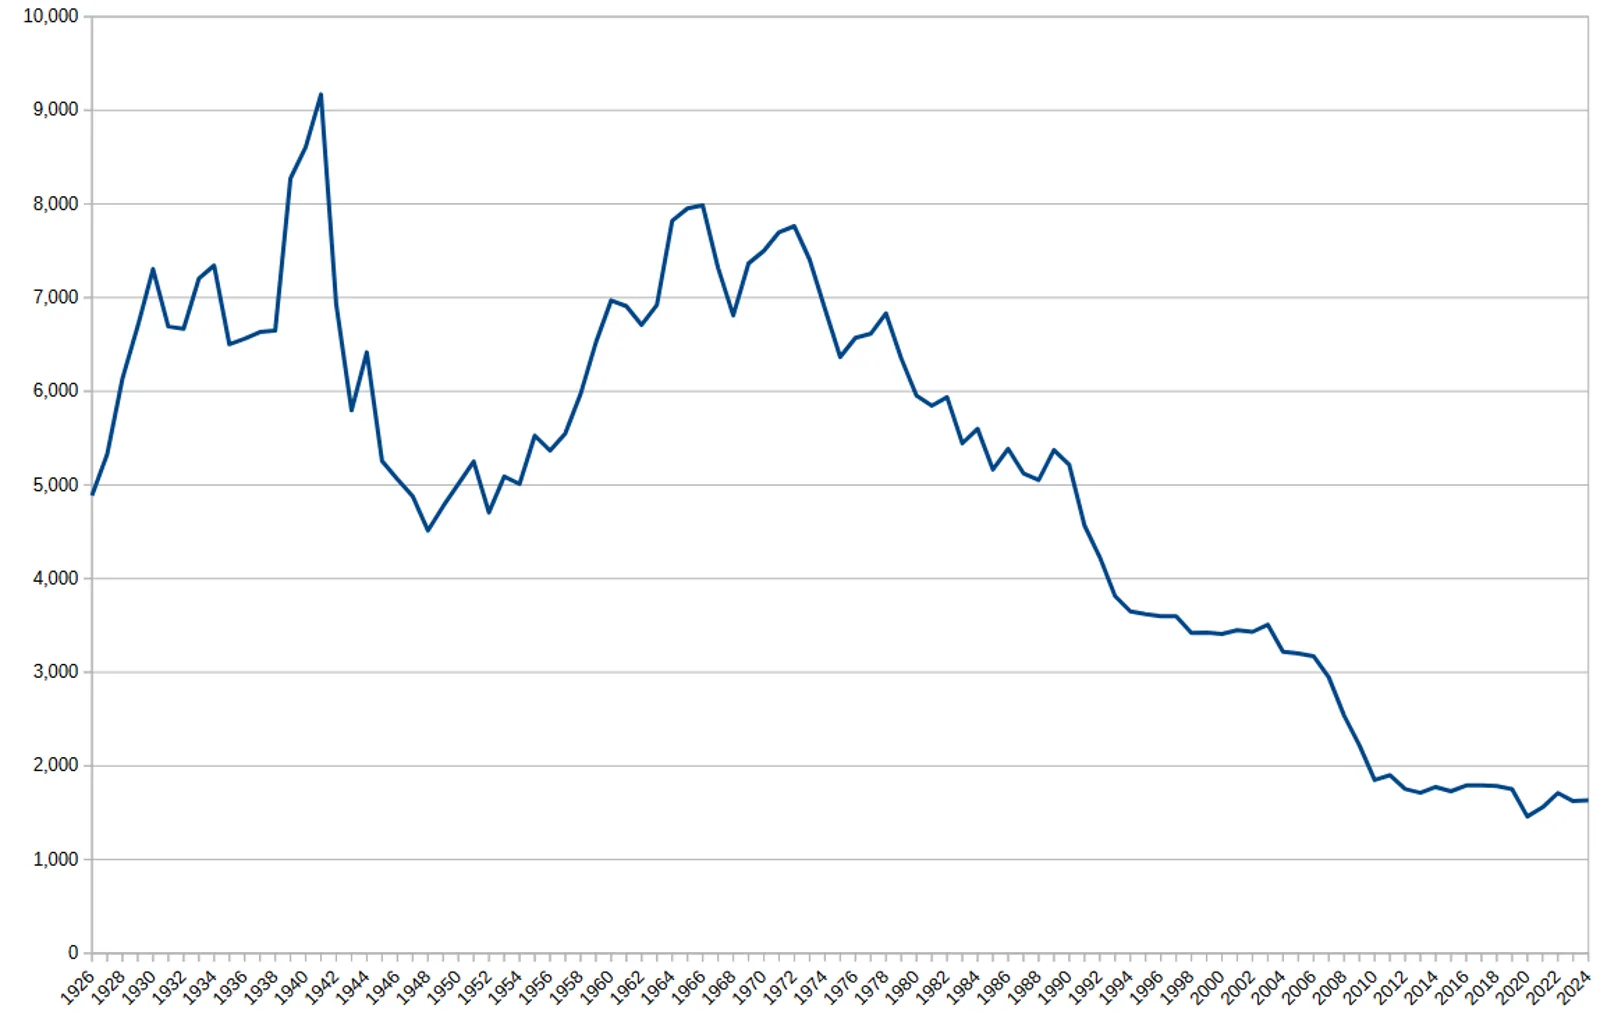
Four very different road systems, four ways of counting the dead, and what the official figures say about how each has changed.
The United States recorded 39,254 road deaths in 2024. The European Union recorded 25,100 in 2018, down from over 50,000 in 2000. India's National Crime Records Bureau counted 155,622 in 2021. Britain's annual toll peaked at 9,169 in 1941 and has generally fallen since 1966.
India's National Crime Records Bureau counted 155,622 road deaths in 2021, the most since 2014. The United States recorded 39,254 in 2024, and the European Union 25,100 in 2018. Those three numbers come from different years and different counting rules, and so do the British figures, which date back to 1926 and show a fall that critics have questioned.
How many people die on US roads each year?
In 2024 there were 39,254 motor vehicle deaths in 36,297 fatal crashes, an average of 107 deaths and 99 crashes a day. In 2022 there were 42,795 deaths, and in 2016 the National Highway Traffic Safety Administration (NHTSA) reported 37,461 deaths in 34,436 fatal crashes, 102 a day.
NHTSA's tally covers public roads only. Parking lots, driveways and private roads are left out, as are indirect car-related deaths. Between 1899 and 2024 the United States recorded 4,036,087 traffic fatalities in total.
Only two other causes kill more Americans by accident than motor vehicle crashes. For people aged 5 to 22 crashes head the list of preventable causes of death, for those aged 23 to 67 they rank second, and they are a significant cause of death among pregnant women.
Britain beat its first national casualty target: deaths fell 39% and serious injuries 45% by 2000.
Have US road deaths gone up or down?
Both, across different eras. From the start of recorded statistics until the 1970s, total deaths generally climbed, with pauses only during the Great Depression and the Second World War. Between 1979 and 2005 the annual number fell by 15% and the number per capita by 35%. The 32,479 deaths of 2011 were the lowest in 62 years, back to 1949. Since then the yearly count has climbed again, to 42,795 in 2022, before easing to 39,254 in 2024.
How many people die on British roads?
Great Britain has kept an official record since 1926, when there were 4,886 deaths in about 124,000 reported injury crashes. Reported Road Casualties Great Britain, the Department for Transport's annual publication since 1951, is built mainly on police STATS19 returns. Northern Ireland reports separately through the Police Service of Northern Ireland.
Between 1951 and 2006 a total of 309,144 people died and 17.6 million were injured on British roads. The worst year ever was 1941, with 9,169 deaths during the Second World War, and the worst in peacetime was 1966, with 7,985. All three casualty categories, deaths, serious injuries and slight injuries, have mostly trended down since 1966. For killed or seriously injured casualties since 1992, each ten-year fall measured against the preceding five-year average has been roughly 40%.
Equipment helped. Front seatbelts became compulsory on new cars from 1972, though wearing them was not required until 1983, and rear belts followed on new cars from 1986. Airbags became popular from around 1993, by which time antilock brakes were already common. A gradual fall in the number of older vehicles lacking these features also reduced casualties over the long term. Against that, vehicles on the road multiplied, from roughly 4 million in 1950 to more than 34 million by 2010.
Targets pushed the trend. A BBC documentary, "The biggest epidemic of our times," prompted roads minister Peter Bottomley in 1987 to fix the first national target: a one-third cut in road casualties by 2000, measured against 1981 to 1985. The goal was beaten: deaths fell 39% and serious injuries 45% across the period.
In 1999 only Sweden had safer roads in Europe than Britain, and the government set a new goal for 2010 against the average for 1994 to 1998: 40% fewer people killed or seriously injured, 50% fewer children killed or seriously injured, and a 10% cut in the rate of slight injuries per 100 million vehicle kilometres. Measured in 2009, the outcome was 44% fewer killed or seriously injured, 61% fewer child casualties of that kind, and a 37% lower slight casualty rate. More recently, the Department for Transport's 2025 factsheets on vulnerable road users reported 386 motorcyclist deaths and 79 pedal cyclist deaths.
Can the British figures be trusted?
Deaths, yes; injuries, less so. STATS19 records incidents on the highway that police attend or learn about within 30 days and in which at least one person is killed or injured. Two studies in 2006 tested its accuracy, and the Department for Transport concluded that the death figures were accurate while the actual number of injuries was likely considerably higher than reported, possibly three times higher.
One study, published in the British Medical Journal by Gill and colleagues, compared police data with hospital statistics from 1996 to 2004. Police figures for killed or seriously injured fell from 85.9 to 59.4 per 100,000, but hospital admissions for traffic injuries did not, so the authors concluded the fall reflected less complete reporting rather than a real drop. A second, by Ward and colleagues for the Department, found death counts reliable, with no significant under-reporting, but that serious injury was partly a matter of judgment, and it recommended triangulating several data sources.
The Department's own 2008 report accepted that a considerable share of non-fatal casualties are unknown to police, and estimated total casualties nearer 800,000 a year, a figure that may itself be inflated by the so-called compensation culture. The government is not convinced that the reductions in reported injuries are anything other than real, and in 2008 it retitled the report "Reported Road Casualties Great Britain."
A different criticism came from Mayer Hillman, John Adams and John Whitelegg, who argued that roads may feel so dangerous that people avoid them. They noted that British children on foot fare worse than the European average, though the all-ages figure beats it, that children's independent mobility is increasingly restricted with fear of traffic cited as a dominant cause, and that distances walked have fallen more than in other European countries.
How many people die on European roads?
The European Union has the safest roads in the world, with 49 deaths per million inhabitants in 2018. Over 50,000 people died on Europe's roads in 2000, over 35,000 in 2009 and 25,100 in 2018, when 135,000 were seriously injured. The World Health Organization's European region, which has 49 countries, puts annual totals higher, at about 120,000 deaths and 2.4 million injuries, and for adolescents and young adults road injuries kill more than anything else.
For each death, estimates say 4 people are permanently disabled, 10 suffer brain or spinal cord damage, 10 are seriously injured and 40 are lightly hurt. The bill to European society is put at 130 billion euros a year. Speed is the main cause, followed by drink or drugs and distraction from phones, radios and navigation devices.
Counting is harder than it sounds. The 1968 Vienna Convention defines a fatal road accident as one in which a person dies at the scene or within thirty days, and most EU countries have adopted that. France counted deaths at six days until 2005, using multipliers of 1.057 up to 2004 and 1.069 afterwards to compare with its neighbours. Serious injuries are worse: without a common method, the European Commission estimated 120,000 while another count found between 206 and 222 thousand a year among 23 member states.
Who has the safest roads in Europe?
National averages hide local gaps. East Sweden (15), Berlin (14), Oslo and Hamburg (11), Vienna (7) and Stockholm (6) had 2015's lowest rates per million inhabitants. At the other end sat Kastamonu in Turkey (192) and Belgium's province of Luxembourg (210).
Ireland won the 2019 PIN award as the EU's best performer, with 30 deaths per million inhabitants in 2018. Its 3.5 deaths per billion vehicle-kilometres were second to Sweden's 3.4.
Siem Oppe's pattern of national development explains some of the spread. The poorest countries have few trips and low motor traffic, so deaths per million stay under 30. Car use then surges and the rate passes 200. In the richest countries, congestion and mature safety policies bring it back to below 80.
Who dies also differs. In 2013 car drivers and passengers made up the greatest share of road deaths at 45%, followed by pedestrians at 22%, with motorcycle deaths especially high in Mediterranean countries. Since 1999 the EuroRAP programme has star-rated major roads on how well their design protects car occupants in head-on, run-off and junction crashes, and four stars is best. In Britain it points to rural roads: two thirds of deaths happen there, single carriageways account for 80% of rural deaths and serious injuries, and 40% of rural car occupant casualties come from cars hitting roadside objects such as trees.
How do Europe, India, the US and Britain compare?
| Place | Latest figure | Earlier benchmark |
|---|---|---|
| United States | 39,254 deaths in 2024 | 32,479 in 2011, the lowest in 62 years |
| European Union | 25,100 deaths in 2018, or 49 per million inhabitants | Over 50,000 in Europe in 2000 |
| India | 155,622 deaths in 2021, according to the NCRB | 16.6 per 100,000 in 2013, according to the WHO |
| Great Britain | 386 motorcyclist and 79 pedal cyclist deaths in the 2025 factsheets | 7,985 deaths in 1966, the peacetime peak |
How many people die on Indian roads?
According to the National Crime Records Bureau, India recorded 155,622 fatalities in 2021, the highest since 2014, and 69,240 of those deaths involved two-wheelers. A study by IIT Delhi found that national highways make up only 2% of India's road length but account for 30.3% of all road accidents and 36% of deaths.
A WHO global survey put India's road fatality rate at 16.6 per 100,000 people in 2013. That sat close to the world average of 17.4, below the 24.1 for low-income countries and above the 9.2 for high-income ones. Deaths ran at 13 an hour in 2008 and 14 in 2009, and the organisation Indians for Road Safety said 15 people died every hour in 2015. More than 40% of casualties involve motorcycles and trucks, and the afternoon and evening peak hours are the most collision-prone.
Local pictures vary. Tamil Nadu has led the country for road collisions over ten years, and Chennai, its capital, has more crashes than any other city. The frequency of collisions in New Delhi is said to be 40 times higher than in London. Experts warn that real totals are probably higher, because many crashes go unreported and victims who die hours or days later are not counted.
One ranking is more upbeat. According to the Zutobi annual report, India ranks 49th for road safety worldwide, ahead of the United States at 51st.
What causes road deaths in India and what does it cost?
The WHO report on global road safety named driving over the speed limit, drink driving and not using helmets and seat belts as the main causes. On four-lane national highways without controlled access, failing to hold a lane or yield when turning is a leading cause, and riders of motorcycles and motorised three-wheelers form the next biggest group of victims. A US Insurance Institute for Highway Safety study shows seat belts significantly cut the risk of injury, yet there is no enforcement of belt use in cars.
The economic loss is large. India's Planning Commission estimated an annual loss of $10 billion (INR 550 billion) in 1999-2000, and in 2012 the International Road Federation put it at $20 billion (INR 1 trillion), counting victim costs, property damage and administration.
What is India doing about road safety?
The Road Transport and Safety Bill of 2014 was meant to set a framework for safer, faster and cheaper movement of passengers and freight. In July 2015 Prime Minister Narendra Modi said laws to improve road safety would be introduced soon, and a new bill is under preparation, with experts calling for comprehensive national legislation.
Others are working on the problem too. The Central Road Research Institute has built an online portal for reporting collisions people witness, and a low-cost device developed by researchers blocks a driver's phone calls while allowing calls to other passengers. Critics are blunt, though. The Road Federation says politicians lack the will to curb collisions, and ArriveSafe's Harman Singh Siddhu points to a widespread disregard for traffic rules and notes that no celebration was held in India for the United Nations Decade of Action for Road Safety.
What does this mean for a driver?
The figures point to the same causes everywhere: speed, drink and drugs, distraction, and for riders no helmet. They also show that safer equipment helped. Britain's decline since 1966 followed seatbelts, rear belts and airbags, and the EU's safest-in-the-world rate of 49 per million inhabitants reflects decades of policy. India's own list of causes includes missing helmets and seat belts. Rural single carriageways are the dangerous places in Britain, and national highways are in India.
Vision Zero aims for no road deaths in Europe by 2050
The European Commission's Vision Zero plan aims to bring road fatalities to zero by 2050. Its Road Safety Programme sought to halve deaths between 2011 and 2020, but with only a 20% reduction by 2018 that target looked implausible. An amendment to the Road Infrastructure Safety Management directive, proposed in 2018, was adopted in November 2019. In India, a new road safety bill is under preparation.