A bridge-building programme in New York, a 2004 review of dozens of studies and a Minnesota experiment that switched off 433 ramp meters.
Induced demand is the extra traffic that fills new road capacity, because quicker journeys make driving cheaper and attract more trips. A 2004 meta-analysis found a 10 percent rise in lane miles produced a 10 percent rise in vehicle miles within a few years, while ramp meters and managed lanes are tools for managing demand rather than simply adding capacity.
Add 10 percent more lane miles to a road network and, a 2004 review of dozens of studies found, vehicle miles travelled jump 4 percent at once and a full 10 percent within a few years, filling all the new capacity. Planners call the effect induced demand. It explains why widened roads so often fill again, and why some cities meter on-ramps or price the fast lane.
What is induced demand?
Induced demand, which goes by other names such as induced traffic, is the extra travel that appears when road space is added and eats up the capacity. It is a standard argument against widening roads as a cure for congestion, and it may also feed urban sprawl and affordable housing problems. Planner Jeff Speck described it as the one certainty everyone in the profession admits and almost nobody acts on.
A 1999 paper by Lee, Klein and Camus gave the terms economic definitions. Induced traffic means a move along the short-run demand curve: existing residents make new trips because driving has become faster. Induced demand means a move along the long-run curve: it includes every trip by people who relocated to take advantage of the wider road. The opposite effect, reduced demand, is also seen.
A related idea is latent demand, which is travel that people want but cannot realise because of constraints. Before a new road opens, those drivers may have used other transport, travelled off-peak or skipped the trip. Once capacity arrives, the pent-up travel becomes actual traffic, which is why latent demand is hard to separate from the generated demand that follows.
Widening a road lowers the price of a journey, and when a journey gets cheaper, people take more of them.
Who first noticed that new roads fill up?
An executive of an electric railway company in St. Louis told the Transportation Survey Commission in 1930 that wider streets only bring more cars and denser jams. The pattern was clearest in New York, where the highway-building of Robert Moses kept repeating it.
Moses opened the Triborough Bridge to relieve the Queensborough Bridge, then the Bronx-Whitestone Bridge to relieve the Triborough. Traffic counts on all three rose until each was as jammed as the first had been. New Long Island parkways filled at once without relieving the old ones, and the Brooklyn-Battery Tunnel failed to ease the Queens-Midtown Tunnel and the East River bridges. By 1942 Moses answered with a programme to expand or create 200 miles (300 km) of roads, including the Throgs Neck and Verrazzano-Narrows bridges, as described by his biographer Robert Caro.
In Britain, J. J. Leeming, a county surveyor from 1924 to 1964, wrote in 1969 that motorways and bypasses generate traffic. As an example he gave the A1(M) Doncaster Bypass, which opened in 1961. By 1998 Donald Chen could quote a British Transport Minister as saying the country could not tackle its traffic problem by building more roads.
In 1989 the Southern California Association of Governments reported that extra lanes or double-decked freeways would make only a cosmetic difference. A University of California, Berkeley study of 30 California counties from 1973 to 1990 found that each 10 percent rise in capacity brought 9 percent more traffic within four years. Engineers like to say that treating congestion by adding capacity is like treating obesity by loosening your belt. Speck calls the 1993 book The Elephant in the Bedroom, written by Stanley Hart and Alvin Spivak, the seminal text.
Why does a faster road attract more traffic?
Every journey has a price, known as its generalised cost. It combines out-of-pocket costs such as fuel and tolls with the value of the time spent travelling. When a road gains capacity, congestion falls and trips get quicker, so the price of each journey drops, and when a price drops, people consume more of the product.
How much more depends on why people travel. Commuting is largely inelastic, since most people go to work whatever fuel costs, while recreational and social trips fall sharply when prices spike. A review of transport research puts the elasticity of traffic with respect to travel time at about -0.5 over the first year and -1.0 over the long haul. A 1.0% saving in travel time therefore adds 0.5% to traffic in the first year and 1.0% over the longer term.
Where does the extra traffic come from?
In the short term, new road space fills in two ways. Diverted travel comes from drivers who switch from other roads or move their trip from a peak they used to avoid. Induced traffic comes from entirely new car trips, by people who would have used public transport or stayed home.
Faster journeys also stretch distances. People choose farther destinations when travel costs less, which may not add trips but does add vehicle miles. Over the long term the pattern reshapes land use, as people pick homes and workplaces farther apart, and that car dependency explains the high long-term elasticities.
Forecasting complicates matters. Planners predict traffic growth from car ownership and economic activity and then treat it as certain, whether or not the road is built, so the traffic induced by the road itself is missing from the numbers.
What do the studies conclude?
| Study | What it found |
|---|---|
| Southern California Association of Governments, 1989 | Adding lanes would have only a cosmetic effect |
| University of California, Berkeley, 30 counties, 1973-1990 | 10 percent more capacity, 9 percent more traffic within four years |
| Surface Transportation Policy Project, 1998 | Metro areas that invested heavily in capacity fared no better on congestion |
| Meta-analysis, 2004 | 10 percent more lane miles, 4 percent more vehicle miles at once, 10 percent in a few years |
| Robert Cervero, California, 1980-1994 | About twenty percent of added capacity preserved, eighty percent absorbed |
| Texas A&M Transportation Institute, 1982-2011 | Extra roadways slowed the rise in congestion |
Do planners and governments accept the idea?
Not always, and not at once. Protesters in the United Kingdom used induced traffic as grounds to oppose road building in the 1970s, 1980s and early 1990s. The government accepted the idea after its own 1994 study by the Standing Advisory Committee on Trunk Road Assessment, though it is still not always factored into planning.
The evidence is not one-sided. The Texas A&M Transportation Institute compared congestion data from 1982 to 2011 and suggested that extra roadways slowed congestion's growth, with growth lower still where capacity kept pace with rising demand. Robert Cervero found that, six to eight years after a freeway expansion, about twenty percent of the added capacity was preserved and about eighty percent absorbed. Half of that absorption came from outside factors such as population and income, the other half from induced demand, mostly higher speeds but also more building. His data came from California between 1980 and 1994, and he noted that it is unknown whether it holds elsewhere.
How does traffic flow work?
Traffic flow is the study of how travellers, vehicles and infrastructure interact, with the aim of moving people efficiently and keeping congestion to a minimum. Traffic behaves in a complex, nonlinear way, forming clusters and sending shock waves forward and backward, much like a ripple that runs along a queue.
Mathematical work began in the 1920s, when the economist Frank Knight analysed how traffic reaches equilibrium; Wardrop refined that into two principles in 1952. Despite modern computing power, there is still no satisfactory general theory. Engineers describe a stream with three variables: speed, flow and density. Flow equals density multiplied by speed, and its inverse is headway, the time gap between vehicles. As a jam forms, headway heads towards infinity.
Density tells the story. Flow is free with fewer than 12 vehicles per mile per lane and stable from 12 to 30. Above 30, past the optimum density, traffic turns unstable, and a small incident can start persistent stop-and-go driving. Beyond 67 vehicles per mile per lane comes breakdown, and jam density, where flow stops completely, usually falls between 185 and 250. Jam density typically runs to about five times critical density.
Time-space diagrams plot time along the horizontal axis and distance along the vertical, drawing each vehicle as a line; vehicles following each other make parallel lines, and a pass makes lines cross. Analysts model traffic at three scales: individual vehicles, fluid-like flows and probability distributions. The Highway Capacity Manual supplies empirical methods.
Bottlenecks matter most. The kinematic wave model of Lighthill and Whitham, from 1955, describes how traffic waves travel and how bottlenecks cut capacity, and the Federal Highway Authority blames them for 40% of congestion. Kerner's three-phase theory proposes a range of capacities at a bottleneck, not a single value. Counts on seven Santiago streets showed that, at peak times, cycle tracks mostly moved more people for each metre of width than car lanes did, even though each lane carried fewer.
What is a ramp meter and how does it work?
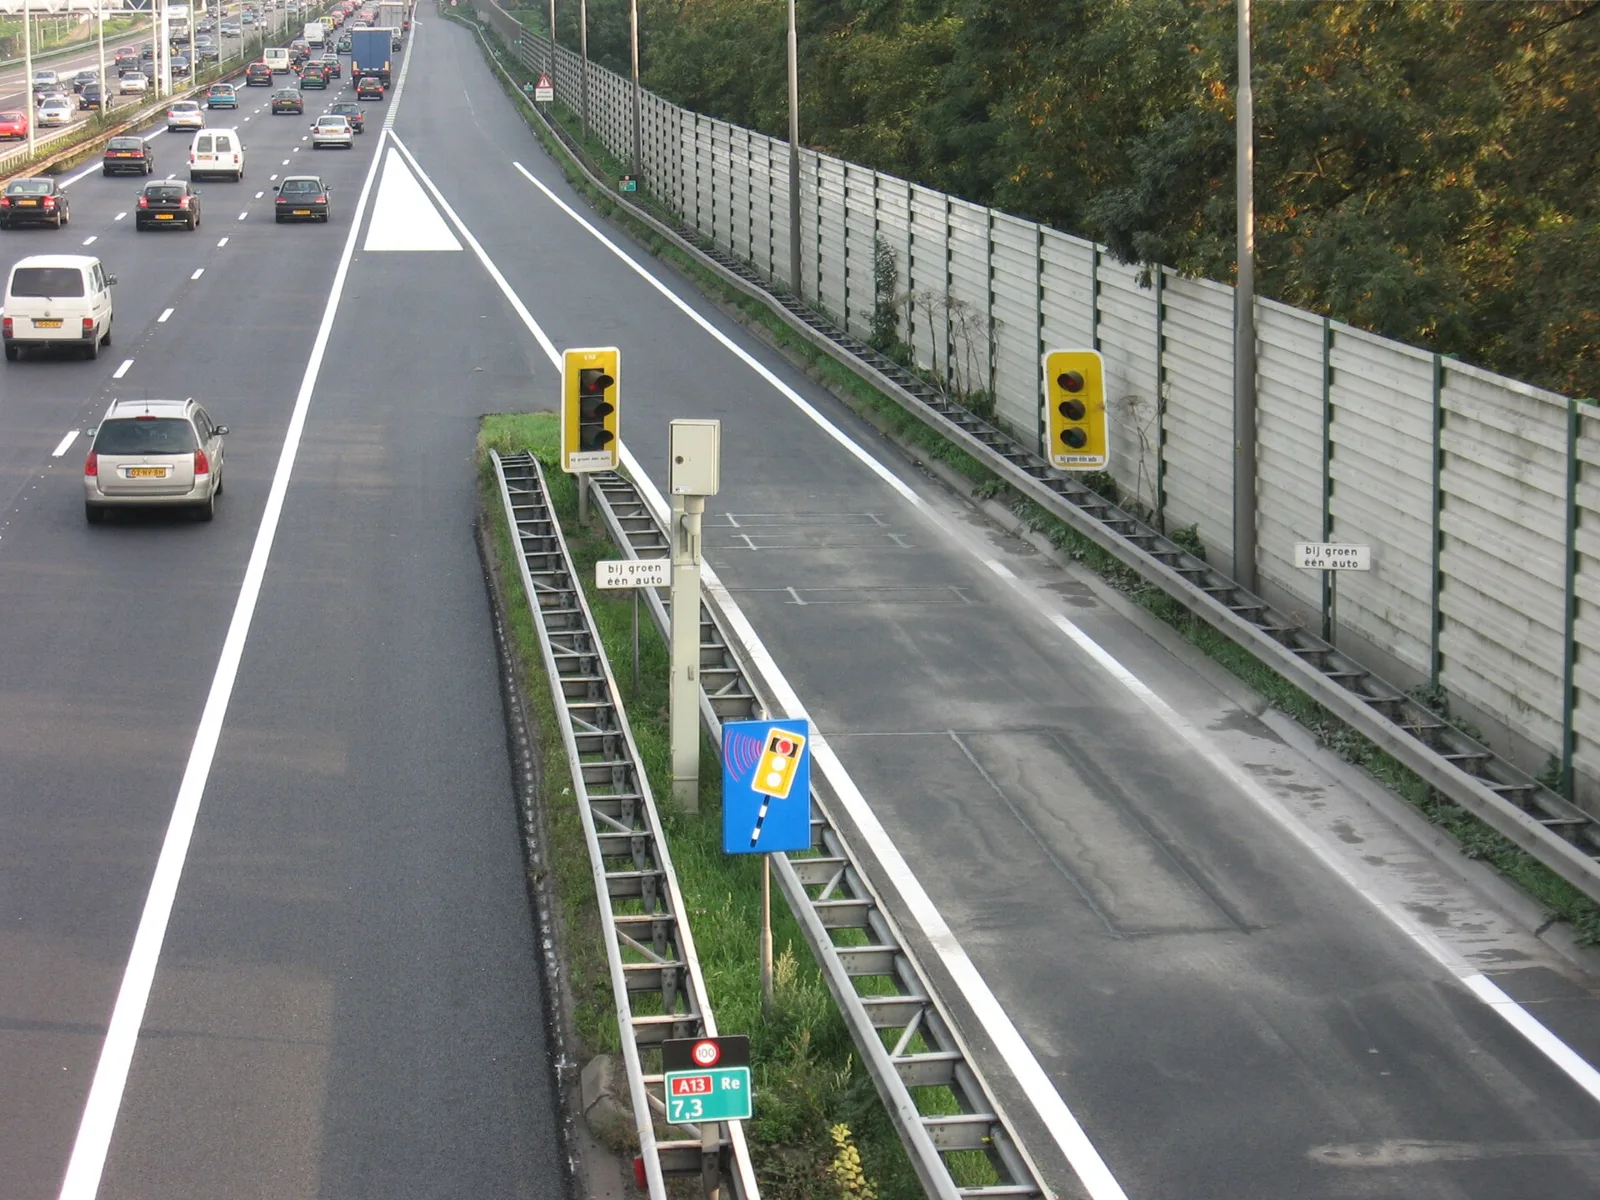
A ramp meter is a traffic signal, usually a simple red and green light with a controller, that regulates vehicles entering a freeway. It cuts the flow onto the road and breaks up groups of cars so they merge one by one. Some meters run only at peak times, showing steady green, flashing yellow in Maryland or nothing off-peak, while others run continuously.
Control comes in layers. A fixed-time meter splits platoons into single vehicles and caps the entry rate, but it ignores the main carriageway. A traffic-responsive meter uses detectors and a microprocessor to read mainline flow and ramp demand and picks a rate to suit. System-wide control links many ramps so that conditions at one affect the rate at others, and Denver showed significant benefits from it. Integrated control goes further, coordinating freeway and arterial-street signals.
Detectors, usually induction loops, sit in the road on the ramp and the mainline. The more congested the freeway, the longer the red phase on the ramp. Algorithms in use or under evaluation include ALINEA, demand control and fuzzy methods. The Dutch RWS strategy sets the number of vehicles let off the ramp as the flow before the ramp subtracted from a pre-set capacity.
Details vary. Some metered ramps have bypass lanes so carpools and buses skip the queue. In California some meters release two or three cars per green. In Ontario the lights stay green whenever no restrictions are in place.
Where have ramp meters been used, and do they work?
The first application was a police officer who stopped traffic on an entrance ramp and released vehicles one at a time. Adolf D. May put the first ramp meters into service in 1963 on Chicago's Eisenhower Expressway, part of Interstate 290. Advances in control theory in the early 1970s followed, and meters spread across many US cities and on Ontario's Queen Elizabeth Way at Mississauga.
The strongest test of their value came in Minnesota in 2000, when a $650,000 experiment switched off all 433 ramp meters in Minneapolis-St. Paul for eight weeks. Cambridge Systematics found that freeway capacity fell 9%, travel times rose 22%, speeds dropped 7% and crashes climbed 26%. Meters remain controversial, though. Minnesota now activates fewer of them, has removed some, and limits timings so no driver waits more than four minutes and vehicles cannot back up onto city streets.
Not every city kept them. Meters were withdrawn in Dallas, San Antonio and Austin, and unused signals can be found on some parkways around New York and Detroit. Mississauga lifts the meter when a queue threatens to back onto city streets, and ramp queues there usually last only 5 to 6 seconds.
Europe has its own record. The UK held its first trial on the M6 near Walsall in 1986, then a 2006 pilot concluded that metering gives a net benefit at the most congested junctions. About 30 sites were done by 2008, and by March 2011 there were 88 on 4,500 miles (7,200 km) of strategic highway. The Netherlands introduced metering in 1989 and had 50 meters by 2006, adding 4 or 5 a year; its pilot found a small benefit and less rat running. Germany meters Autobahns in the Rhine-Ruhr area, Munich and Hamburg, and the EU-funded EURAMP project finished in March 2007.
What are managed lanes?
A managed lane is a highway lane run under a scheme such as access restrictions or variable tolls to improve traffic flow, vehicle throughput, or both. Variants range from high-occupancy vehicle (HOV) lanes to high-occupancy toll, express toll, reversible and bus lanes. Most sit in the United States and Canada, while many other countries manage every lane through active traffic management.
The US Federal Highway Administration describes them as a freeway within a freeway, separated from general lanes and actively managed as needs change. The main precondition is recurring congestion, usually a service level of D or below, with speeds of 30 mph or less. Strategies fall into pricing, vehicle eligibility and access control, and most schemes combine several.
The aim is not always more road. Managed lanes do not require added capacity; their focus is a reliable trip that beats the congestion in the general lanes, so the objective is better management of congestion, not its removal. They work best inside a wider programme with ramp metering, incident management and transit services.
How do toll and HOV lanes work?
Express toll lanes vary their charges to hold higher speeds or volumes than the neighbouring lanes. Tolls rise as a lane nears capacity to deter entry, and some schemes aim to keep a minimum speed, such as 55 mph (85 km/h). High-occupancy toll lanes are free to vehicles with enough passengers while others pay, and hybrids, registered carpools and motorcycles can be exempt.
Tolled lanes may also fund the rebuild. In public-private projects a consortium designs, finances and rebuilds a highway section, then operates the lanes under a concession of, for example, 40 years, with fixed payments for meeting performance targets.
Eligibility rules have been among the most common tools for 40 years. HOV 2+ and HOV 3+ lanes make up the vast majority of managed lanes in the US and Canada, covering more than 1200 North American route-miles (1900 route-kilometers). Most are single lanes beside the general lanes, divided by a painted stripe or buffer or, sometimes, a physical barrier. Some reverse direction, and contraflow lanes borrow an off-peak lane using pylons or movable barriers. HOV bypass ramps let buses and carpools skip ramp meters, and bus lanes and busways are usually part of bus rapid transit.
What does this mean for drivers?
For anyone sitting in a jam, the studies suggest a new lane often brings temporary relief that erodes as more trips appear. The tools described above change what you wait for instead: a ramp meter trades a short wait at the entrance for steadier flow on the main road, and a managed lane sells or rations a reliable journey.
Where is ramp metering heading?
The UK's 2007 summary report said that ramp metering was expected to be used more widely in the coming period, and the Netherlands has been adding 4 or 5 meters a year. Minnesota has developed new ramp control strategies since its 2000 experiment. Italy's Venice bypass metering was introduced as a temporary solution before the permanent Passante di Mestre was built.